Foraging toolkit demo - hungry foragers
Outline
Introduction
In this notebook we use the foraging toolkit to simulate agents that move toward food.
The users are advised to familiarize themselves with the random_foragers.ipynb demo, which contains detailed explanation of the various commands.
The main reference is [1], in particular Fig.2.
[1] R. Urbaniak, M. Xie, and E. Mackevicius, “Linking cognitive strategy, neural mechanism, and movement statistics in group foraging behaviors,” Sci Rep, vol. 14, no. 1, p. 21770, Sep. 2024, doi: 10.1038/s41598-024-71931-0.
[1]:
# importing packages. See https://github.com/BasisResearch/collab-creatures for repo setup
import logging
import os
import random
import time
import dill
import matplotlib.pyplot as plt
import numpy as np
import plotly.io as pio
pio.renderers.default = "notebook"
import collab.foraging.toolkit as ft
from collab.foraging import random_hungry_followers as rhf
logging.basicConfig(format="%(message)s", level=logging.INFO)
# users can ignore smoke_test -- it's for automatic testing on GitHub,
# to make sure the notebook runs on future updates to the repository
smoke_test = "CI" in os.environ
num_frames = 5 if smoke_test else 50
num_svi_iters = 10 if smoke_test else 1000
num_samples = 10 if smoke_test else 1000
notebook_starts = time.time()
Simulation
Compared with the random agents simulation in random_foragers.ipynb, we’ll use more frames, and a larger gridworld environment. The simulation might take a bit longer, so we’ll save it for future use.
Simulation of hungry foragers
Note that rewards have impact on agents’ positions and therefore reward and trace updates are required at every step.
Initialization
Initialize the grid with a specified grid size
Randomly place
num_rewardsrewards on the grid.Normalize the probabilities for forager step size
Forward Simulation
For each frame:
Remove any reward from the frame onwards if a forager is next to it
Compute food traces, i.e. additive scores for points in space-time, with exponential decay and maximum at 1 located at reward locations
For each forager:
Compute visibility for points in forager’s range
Sort visible points by their current accumulated trace score
Move forager to a random position from the top 10 from the ranking above
[2]:
random.seed(23)
np.random.seed(23)
# serialize hungry_sim using dill, as this simulation takes a bit of time
# if hungry sim not in folder, generate, otherwise load
always_generate = False
sim_file = os.path.join("sim_data", "hungry_sim.dill")
if not os.path.exists(sim_file) or always_generate:
# create a new empty simulation (a starting point for the actual simulation)
hungry_sim = rhf.Foragers(
grid_size=60,
num_foragers=3,
num_frames=num_frames,
num_rewards=60,
grab_range=3,
)
hungry_sim() # run the simulation: this places the rewards on the grid
# add hungry foragers and run simulation forward
hungry_sim = rhf.add_hungry_foragers(
hungry_sim, num_hungry_foragers=3, rewards_decay=0.3, visibility_range=6
)
with open(sim_file, "wb") as f:
dill.dump(hungry_sim, f)
else:
print("Loading existing simulation results")
with open(sim_file, "rb") as f:
hungry_sim = dill.load(f)
# display(hungry_sim.foragersDF)
2024-10-28 14:01:03,751 - Generating frame 10/50
2024-10-28 14:01:12,834 - Generating frame 20/50
2024-10-28 14:01:20,240 - Generating frame 30/50
2024-10-28 14:01:25,688 - Generating frame 40/50
[3]:
ft.plot_trajectories(hungry_sim.foragersDF, "Hungry Foragers")
plt.show()
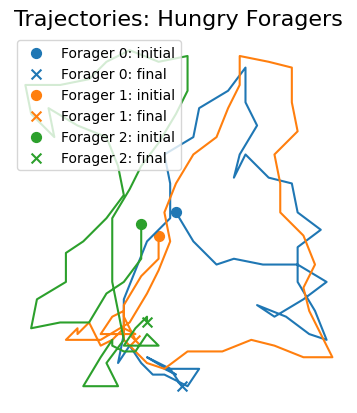
We will use the animate_foragers function with plot_traces=True to show the values of the food traces at every grid point and each frame.
[4]:
ft.animate_foragers(
hungry_sim, width=600, height=400, plot_rewards=True, plot_traces=True, point_size=6
)
Derived quantities
[5]:
# We'll use `proximity`, `food` and `access` predictors
local_windows_kwargs = {
"window_size": 10,
"sampling_fraction": 1,
"skip_incomplete_frames": False,
}
predictor_kwargs = {
"proximity": {
"interaction_length": hungry_sim.grid_size / 3,
"interaction_constraint": None,
"interaction_constraint_params": {},
"repulsion_radius": 1.5,
"optimal_distance": 4,
"proximity_decay": 1,
},
"food": {
"decay_factor": 0.5,
},
"access": {
"decay_factor": 0.2,
},
}
score_kwargs = {
"nextStep_linear": {"nonlinearity_exponent": 1},
"nextStep_sublinear": {"nonlinearity_exponent": 0.5},
}
derivedDF_hungry = ft.derive_predictors_and_scores(
hungry_sim,
local_windows_kwargs,
predictor_kwargs=predictor_kwargs,
score_kwargs=score_kwargs,
dropna=True,
add_scaled_values=True,
)
2024-10-28 14:01:31,635 - proximity completed in 0.29 seconds.
2024-10-28 14:01:32,257 - food completed in 0.62 seconds.
2024-10-28 14:01:32,361 - access completed in 0.10 seconds.
2024-10-28 14:01:32,509 - nextStep_linear completed in 0.15 seconds.
2024-10-28 14:01:32,590 - nextStep_sublinear completed in 0.08 seconds.
/Users/emily/code/collaborative-intelligence/collab/foraging/toolkit/derive.py:56: UserWarning:
Dropped 821/43128 frames from `derivedDF` due to NaN values.
Missing values can arise when computations depend on next/previous step positions
that are unavailable. See documentation of the corresponding predictor/score generating
functions for more information.
[6]:
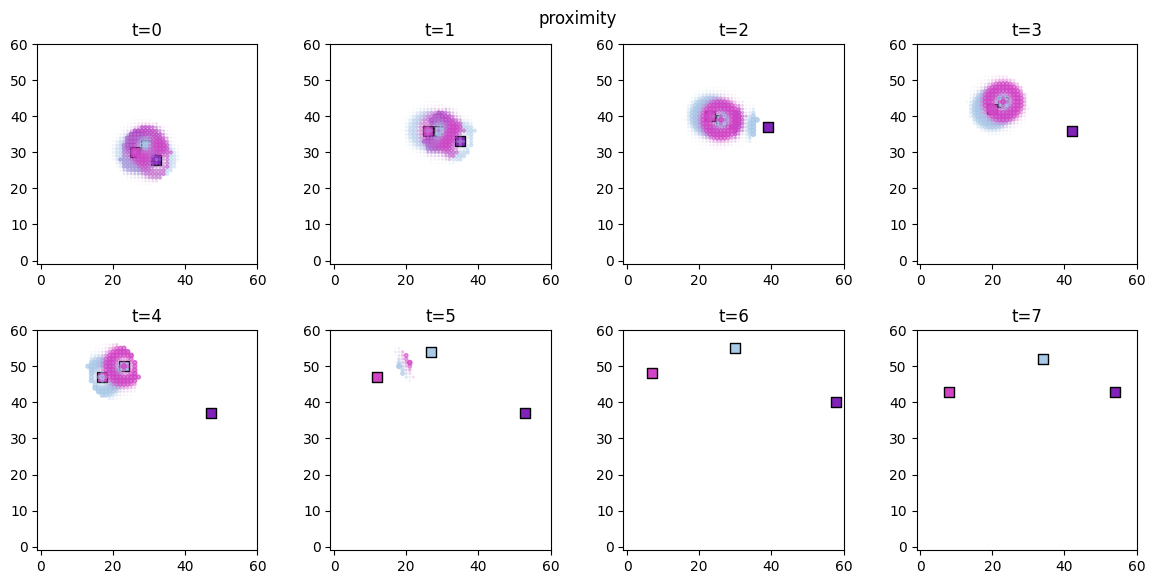
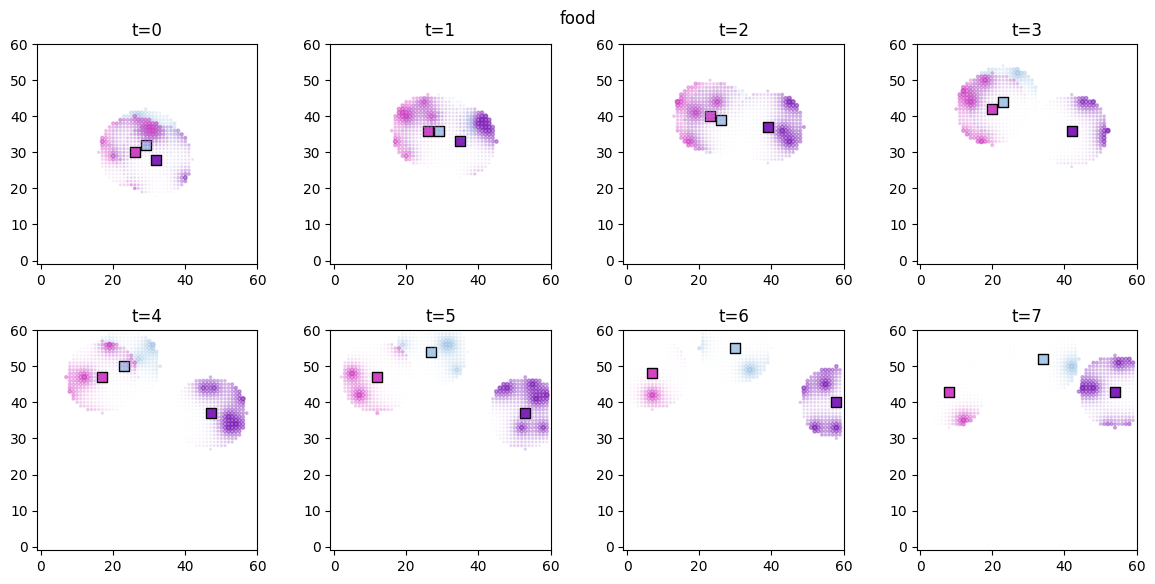
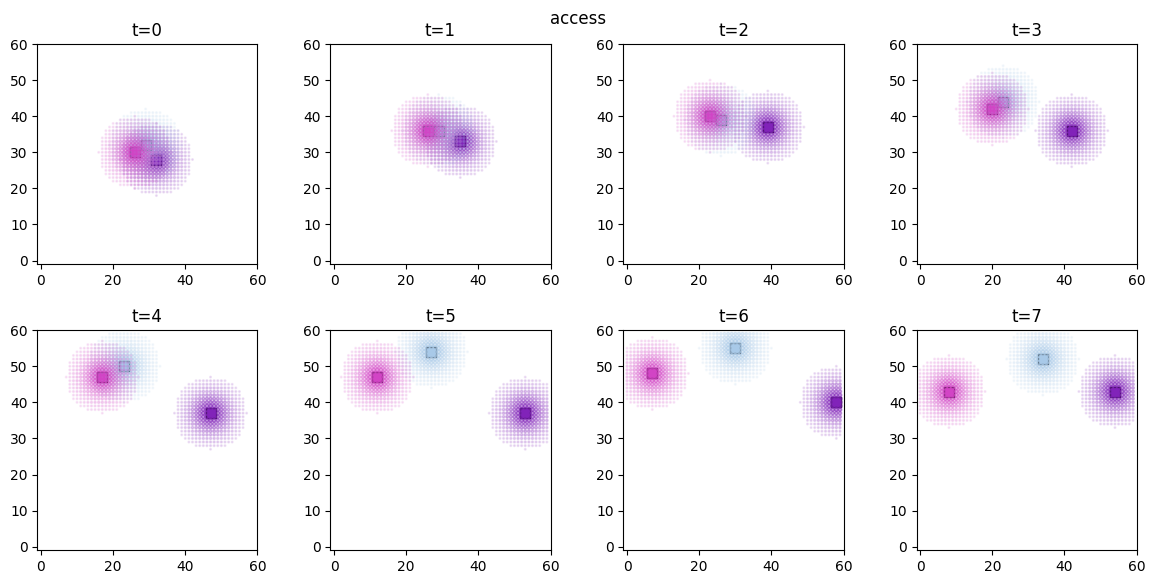
# visualize the spatial distributions of the derived quantities for each forager
for derived_quantity_name in hungry_sim.derived_quantities.keys():
ft.plot_predictor(
hungry_sim.foragers,
hungry_sim.derived_quantities[derived_quantity_name],
predictor_name=derived_quantity_name,
time=range(min(8, num_frames)),
grid_size=60,
size_multiplier=10,
random_state=99,
forager_position_indices=[0, 1, 2],
forager_predictor_indices=[0, 1, 2],
)
plt.suptitle(derived_quantity_name)
plt.show()
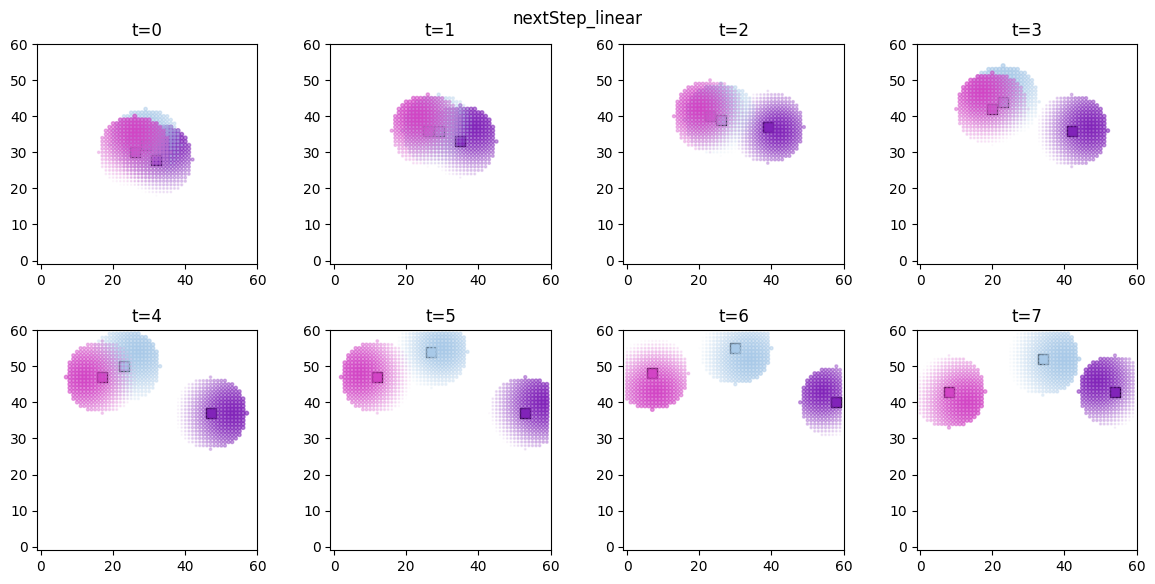
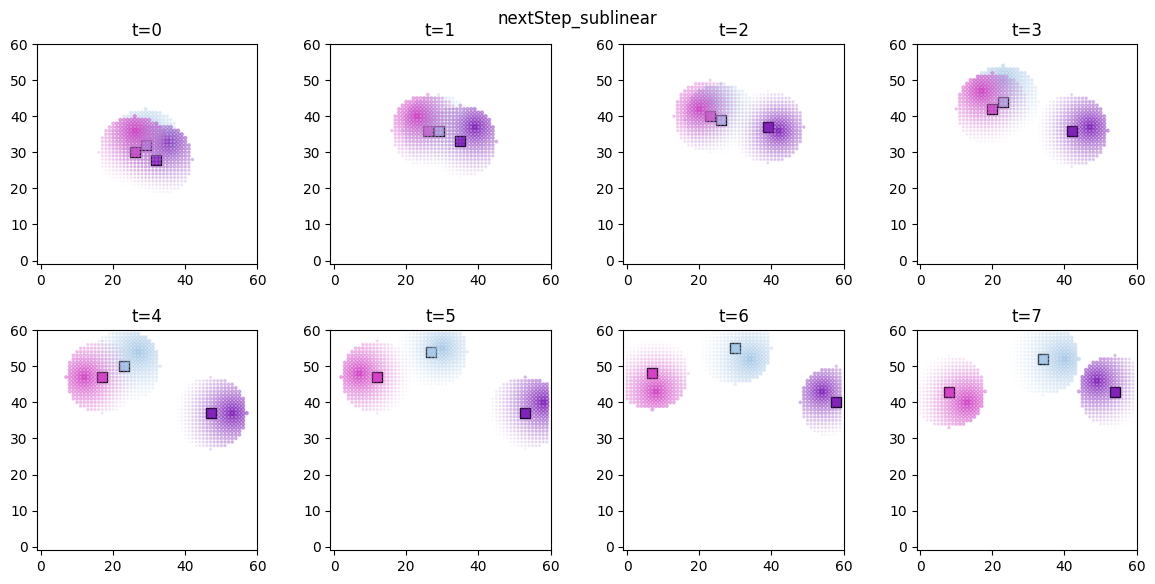
Inference
[7]:
# prepare the training data
predictors = ["proximity_scaled", "food_scaled", "access_scaled"]
outcome_vars = ["nextStep_sublinear"]
predictor_tensors_hungry, outcome_tensor_hungry = ft.prep_data_for_inference(
hungry_sim, predictors, outcome_vars
)
# construct Pyro model
model_sigmavar_hungry = ft.HeteroskedasticLinear(
predictor_tensors_hungry, outcome_tensor_hungry
)
# runs SVI to approximate the posterior and samples from it
results_hungry = ft.get_samples(
model=model_sigmavar_hungry,
predictors=predictor_tensors_hungry,
outcome=outcome_tensor_hungry,
num_svi_iters=1500,
num_samples=1000,
)
selected_sites = [
key
for key in results_hungry["samples"].keys()
if key.startswith("weight") and not key.endswith("sigma")
]
selected_samples = {key: results_hungry["samples"][key] for key in selected_sites}
ft.plot_coefs(
selected_samples, "Hungry foragers", nbins=120, ann_start_y=160, ann_break_y=50
)
# save the samples for future use
with open(os.path.join("sim_data", "hungry_foragers_samples.dill"), "wb") as f:
dill.dump(selected_samples, f)
ft.evaluate_performance(
model=model_sigmavar_hungry,
guide=results_hungry["guide"],
predictors=predictor_tensors_hungry,
outcome=outcome_tensor_hungry,
num_samples=1000,
)
2024-10-28 14:01:35,249 - Sample size: 42307
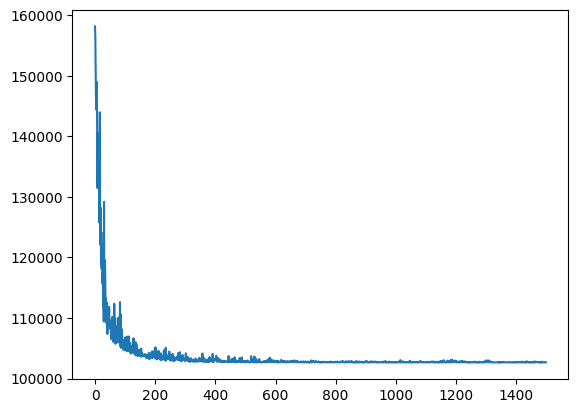
2024-10-28 14:01:35,250 - Starting SVI inference with 1500 iterations.
[iteration 0001] loss: 158130.3125
[iteration 0200] loss: 104908.4688
[iteration 0400] loss: 103011.6641
[iteration 0600] loss: 102709.2344
[iteration 0800] loss: 102773.9375
[iteration 1000] loss: 102669.6719
[iteration 1200] loss: 102952.9688
[iteration 1400] loss: 102743.9531
2024-10-28 14:01:44,620 - SVI inference completed in 9.37 seconds.
Coefficient marginals:
Site: weight_continuous_proximity_scaled_nextStep_sublinear
mean std 5% 25% 50% 75% 95%
0 0.062259 0.013569 0.039397 0.053392 0.062477 0.07096 0.085148
Site: weight_continuous_food_scaled_nextStep_sublinear
mean std 5% 25% 50% 75% 95%
0 0.67286 0.016578 0.645184 0.662119 0.672819 0.684356 0.700079
Site: weight_continuous_access_scaled_nextStep_sublinear
mean std 5% 25% 50% 75% 95%
0 0.514889 0.014533 0.489584 0.505649 0.515537 0.524791 0.538178
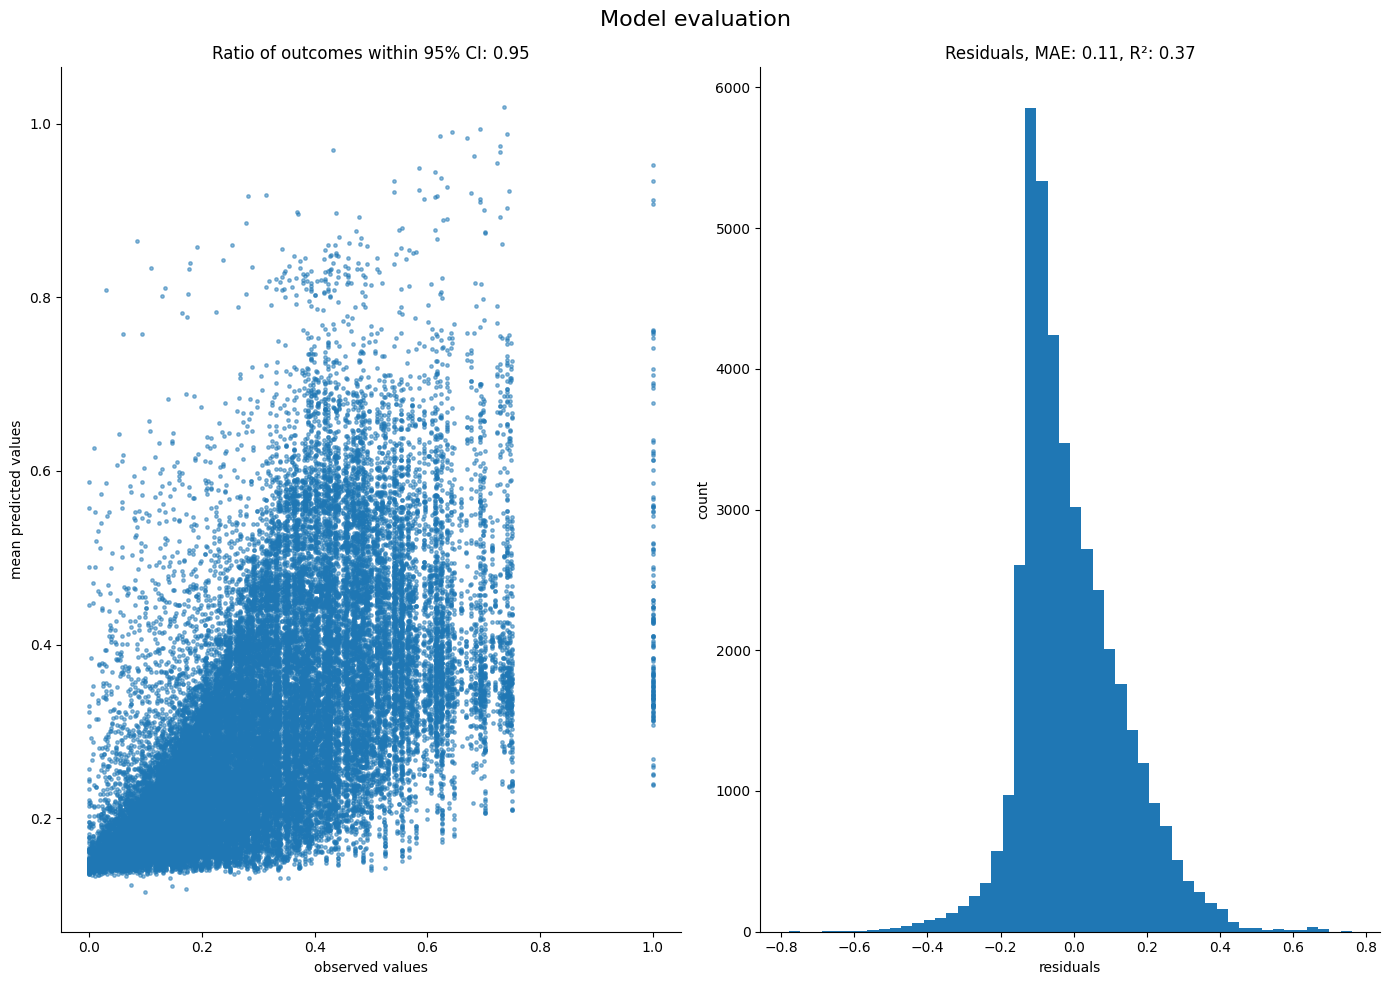
As expected, both access and food are now significant in explaining the agent movements, while proximity has no effect.