Foraging locust with dynamical systems (data)
In order to demonstrate using dynamical systems models to reason about foraging behavior, we analyze data from desert locusts, available at https://zenodo.org/records/7541780, collected as part of the paper Information integration for decision-making in desert locusts by Günzel, Oberhauser, and Couzin-Fuchs. The main result we are trying to replicate with this analysis is that locusts foraging decisions are based on a combination of individually derived and socially derived information.
This notebook focuses on initial data processing. We will load the locust data (training and test set), and compartmentalize it to prepare for further dynamical systems analysis that models the transition rates with which agents move between different compartments. The dynamical systems models are demonstrated in subsequent notebooks.
Please go through the locust dynamical systems notebooks in this order:
[1]:
import os
import time
import matplotlib.pyplot as plt
import numpy as np
import pyro
import seaborn as sns
pyro.settings.set(module_local_params=True)
sns.set_style("white")
import plotly.io as pio
pio.renderers.default = "notebook"
seed = 123
pyro.clear_param_store()
pyro.set_rng_seed(seed)
import matplotlib.pyplot as plt
import pandas as pd
import seaborn as sns
from collab.foraging import locust as lc
from collab.foraging import toolkit as ft
from collab.utils import find_repo_root
root = find_repo_root()
# users can ignore smoke_test.
# it's for automatic testing on GitHub, to make sure the
# notebook runs on future updates to the repository
smoke_test = "CI" in os.environ
smoke_test = "CI" in os.environ
subset_starts = 1 # 420
subset_ends = 30 if smoke_test else 900
desired_frames = 30 if smoke_test else 180
notebook_starts = time.time()
We start taking two of the datasets (to serve as training and validation datasets), with the same number of agents and reward placement, but quite different starting positions. We load, clean and animate the data. Cleaning involves:
discretizing the area into a grid of a specific size and rewriting agents’ positions accordingly.
adding rewards positions described in the original project documentation into the dataframe.
extracting every k-th frame so that the total number of frames is
desired_frames. This is because the recording is with 25 frames per second, originally 45000 frames. Locusts in the experiment move slow enough for lower fidelity to be adequate.potentially picking a subset of the dataset, determined by
subset_startsandsubset_ends.
[2]:
training_data_code = "15EQ20191202"
validation_data_code = "15EQ20191205"
training_data_path = os.path.join(
root, f"data/foraging/locust/{training_data_code}_tracked.csv"
)
validation_data_path = os.path.join(
root, f"data/foraging/locust/{validation_data_code}_tracked.csv"
)
tdf = lc.load_and_clean_locust(
path=training_data_path,
desired_frames=desired_frames,
grid_size=100,
rewards_x=[0.68074, -0.69292],
rewards_y=[-0.03068, -0.03068],
subset_starts=subset_starts,
subset_ends=subset_ends,
)
vdf = lc.load_and_clean_locust(
path=validation_data_path,
desired_frames=desired_frames,
grid_size=100,
rewards_x=[0.68074, -0.69292],
rewards_y=[-0.03068, -0.03068],
subset_starts=subset_starts,
subset_ends=subset_ends,
)
training_object = tdf["subset"]
validation_object = vdf["subset"]
training_rewards = (
training_object.rewardsDF.iloc[:, [0, 1]].drop_duplicates().reset_index(drop=True)
)
validation_rewards = (
validation_object.rewardsDF.iloc[:, [0, 1]].drop_duplicates().reset_index(drop=True)
)
tdf = training_object.foragersDF
vdf = validation_object.foragersDF
# shared
start, end, N_obs = min(tdf["time"]), max(tdf["time"]), len(tdf["time"].unique())
original_frames: 45000
original_shape: (675000, 4)
resulting_frames: 180
resulting_shape: (2700, 4)
min_time 1
max_time 180
original_frames: 45000
original_shape: (675000, 4)
resulting_frames: 180
resulting_shape: (2700, 4)
min_time 1
max_time 180
[3]:
ft.animate_foragers(
training_object,
plot_rewards=True,
height=700,
point_size=10,
)
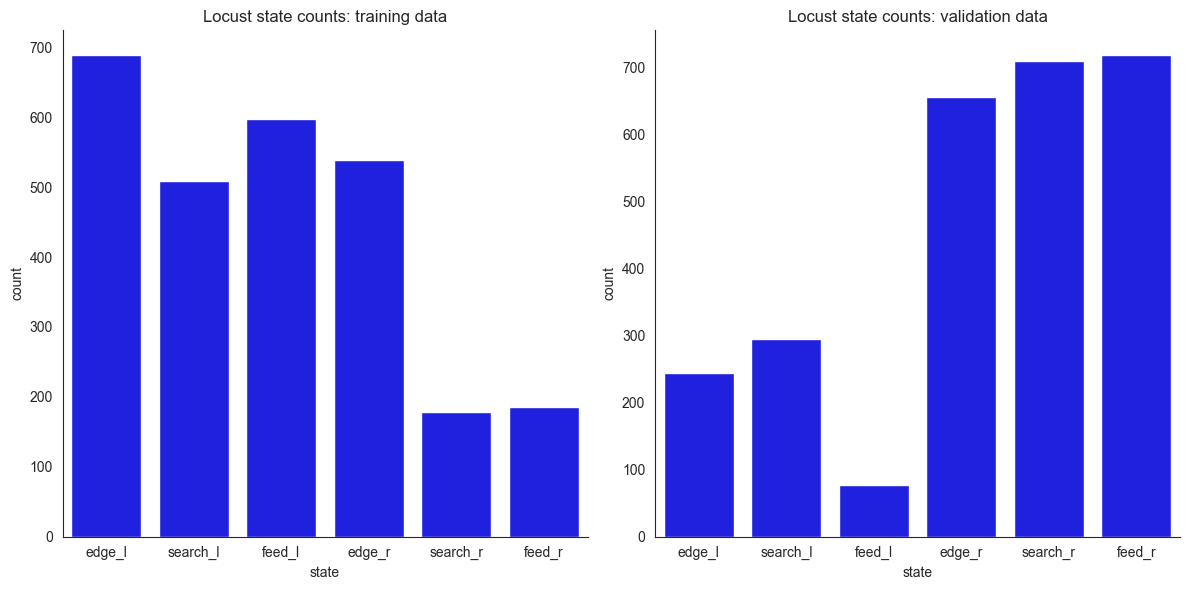
For the dynamical systems model, we want to divide the arena into compartments, so that we can model the rates at which agents transition between compartments. Observing this dataset, the general intuition is that some locusts spend time near the edge (edge), some feeding next to the rewards (feed), and some searching (search) in between these areas. The distinction between feeding and non-feeding locusts has been made based on location: those reasonably close to rewards and fairly
stationery were deemed feeding and the distance threshold was selected by comparison of the animations with the actual footage. Further, since there are two reward positions (left/right), we split the compartments between left and right (l/r). This gives the following empirical distributions of time spent in the compartments and the associated animations. Notice how the empirical distributions of positions differ between the training and the validation data - this is on purpose. Feel
free to inspect the animations to see the differences in more detail.
[4]:
tdf_cat = lc.compartmentalize_locust_data(
training_rewards, tdf, center=50, feeding_radius=10, edge_ring_width=4
)
vdf_cat = lc.compartmentalize_locust_data(
validation_rewards, vdf, center=50, feeding_radius=10, edge_ring_width=4
)
fig, axes = plt.subplots(1, 2, figsize=(12, 6))
sns.barplot(
x=tdf_cat["state"].value_counts().index,
y=tdf_cat["state"].value_counts(),
color="blue",
ax=axes[0],
order=["edge_l", "search_l", "feed_l", "edge_r", "search_r", "feed_r"],
)
axes[0].set_title("Locust state counts: training data")
sns.despine(ax=axes[0])
sns.barplot(
x=vdf_cat["state"].value_counts().index,
y=vdf_cat["state"].value_counts(),
color="blue",
ax=axes[1],
order=["edge_l", "search_l", "feed_l", "edge_r", "search_r", "feed_r"],
)
axes[1].set_title("Locust state counts: validation data")
sns.despine(ax=axes[1])
plt.tight_layout()
# plt.savefig("locust_state_counts.png")
plt.show()
[5]:
t_unique_states = set(tdf_cat["state"])
v_unique_states = set(vdf_cat["state"])
# these will be added to ensure the animation starts with
# all states represented
# ignore the initial frame in the animation
t_initial_fake_positions = pd.DataFrame(
{
"x": np.zeros(len(t_unique_states), dtype=int),
"y": np.zeros(len(t_unique_states), dtype=int),
"state": sorted(list(t_unique_states)),
"time": [(start - 1)] * len(t_unique_states),
"forager": np.zeros(len(t_unique_states), dtype=int),
}
)
v_initial_fake_positions = pd.DataFrame(
{
"x": np.zeros(len(v_unique_states), dtype=int),
"y": np.zeros(len(v_unique_states), dtype=int),
"state": sorted(list(v_unique_states)),
"time": [(start - 1)] * len(v_unique_states),
"forager": np.zeros(len(v_unique_states), dtype=int),
}
)
t_df_cat_vis = pd.concat([t_initial_fake_positions, tdf_cat])
training_object.foragersDF = t_df_cat_vis
v_df_cat_vis = pd.concat([v_initial_fake_positions, vdf_cat])
validation_object.foragersDF = v_df_cat_vis
ft.animate_foragers(
training_object,
plot_rewards=True,
height=600,
point_size=10,
color_by_state=True,
)
# note they tend to be on the right side
# unlike in the training data
# this is a good thing
ft.animate_foragers(
validation_object,
plot_rewards=True,
height=600,
point_size=10,
color_by_state=True,
)
[6]:
# save the cleaned data
if not smoke_test:
training_data_path = (
f"data/foraging/locust/ds/locust_counts{training_data_code}.pkl"
)
validation_data_path = (
f"data/foraging/locust/ds/locust_counts{validation_data_code}.pkl"
)
training_count_data_dic = ft.tensorize_and_dump_count_data(
tdf_cat, training_data_path
)
validation_count_data_dic = ft.tensorize_and_dump_count_data(
vdf_cat, validation_data_path
)
[7]:
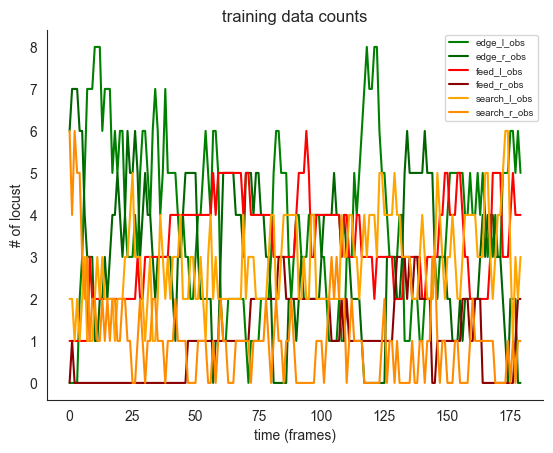
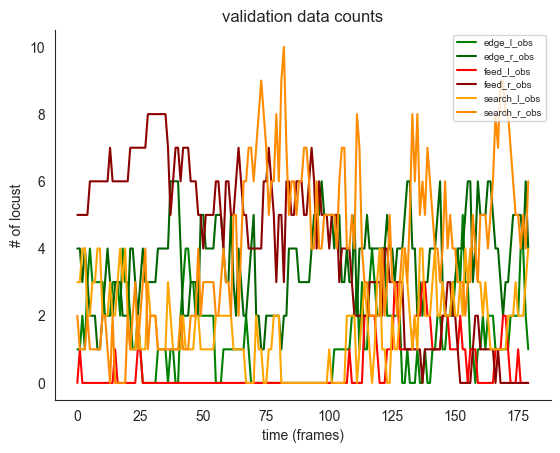
# first, we inspect the resulting trajectories
if not smoke_test:
training_count_data = training_count_data_dic["count_data"]
validation_count_data = validation_count_data_dic["count_data"]
# each frame is 10 seconds
ft.plot_ds_trajectories(
training_count_data, window_size=0, observed=True, title="training data counts"
)
plt.show()
ft.plot_ds_trajectories(
validation_count_data,
window_size=0,
observed=True,
title="validation data counts",
)
plt.show()
[8]:
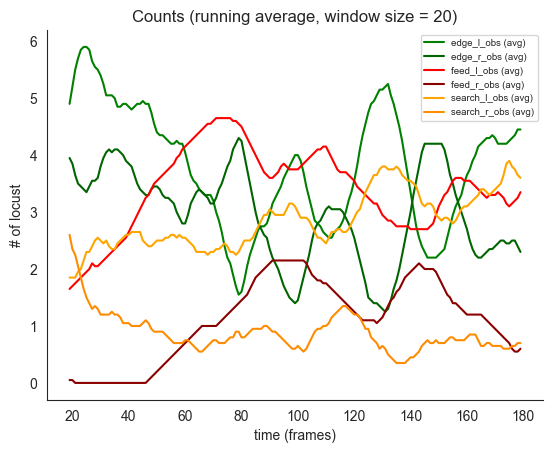
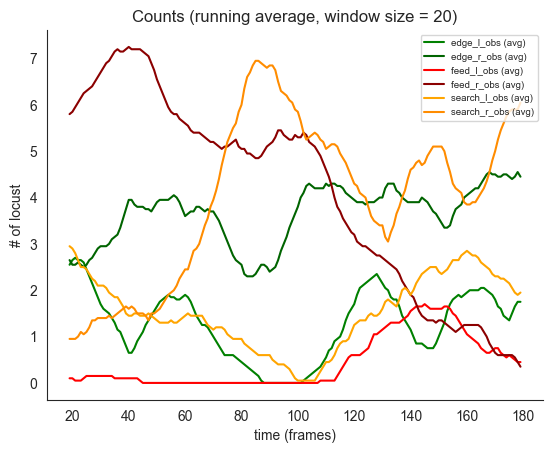
# now moving averages with window size 20
# note the initial tendencies for edge to drop and move to search and feed
# and slight tendency to head towards the edge near the end of the period
if not smoke_test:
ft.plot_ds_trajectories(training_count_data, window_size=20, observed=True)
# plt.savefig("training_data_counts.png")
plt.show()
ft.plot_ds_trajectories(validation_count_data, window_size=20, observed=True)
# plt.savefig("validation_data_counts.png")
plt.show()
[9]:
notebook_ends = time.time()
print(
"notebook took",
notebook_ends - notebook_starts,
"seconds, that is ",
(notebook_ends - notebook_starts) / 60,
"minutes to run",
)
notebook took 5.764779090881348 seconds, that is 0.09607965151468913 minutes to run